The Reporting Interface
The Reporting Interface allows you to view and create reports based on your ticket data, providing you with detailed metrics about your ticket activity.
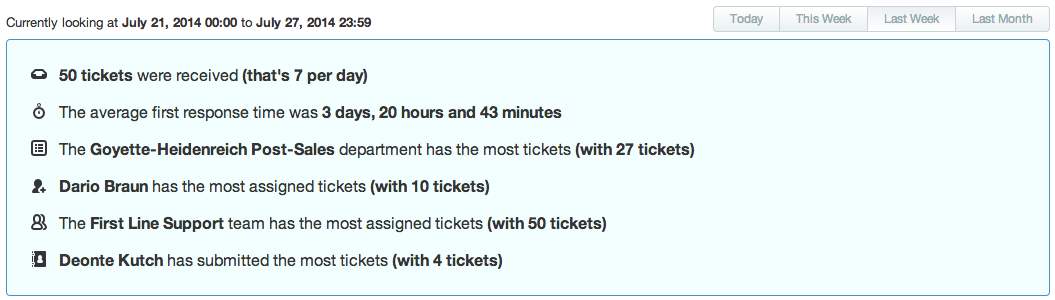
Whenever you visit the Reporting Interface, you will be first greeted by an overview of all the tickets submitted over today, this week, last week, or last month, enabling you to get a quick grasp on your support statistics. (It won't display the department, team or staff member with the 'most' assigned tickets if they've still only got 1).
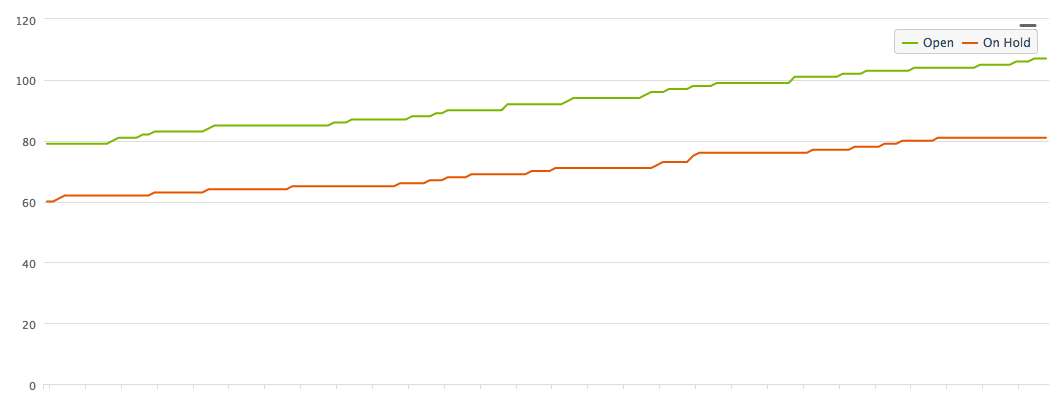
You will also be able to view a graph showing the number of tickets open or on hold, and how these numbers have changed over the specified period of time:
By clicking on one of the default reports from the left navigation, you can gain more detailed information about your tickets, and if these are not sufficient, you can create your own reports by clicking 'Add New Report' and using our own query language, SPQL.